May 12 Update
Putting together a table with all the results from the comments. Putting at the top own measurements where I had control over the environment and have more confidence in measurement consistency (e.g. using the right model, similar size messages, ensuring settings consistency etc.).
| Spec | Result |
|---|---|
| Apple M1 Pro CPU | 14.8 tok/s |
| Apple M1 Pro GPU | 19.4 tok/s |
| AMD Ryzen 7 7840U CPU | 7.3 tok/s |
| AMD Radeon 780M iGPU | 5.0 tok/s |
| AMD Ryzen 5 7535HS CPU | 7.4 tok/s |
| GeForce RTX 4060 Mobile OC GPU | 37.9 tok/s |
| GeForce RTX 4060 Mobile OC FA GPU | 39.7 tok/s |
| GeForce RTX 4090 OC (+180 Core, +1500 Mem) GPU | 108.5 tok/s |
| GeForce RTX 4090 OC FA (+180 Core, +1500 Mem) GPU | 119.1 tok/s |
| --- Contributed by commenters --- | --- |
| M3 Pro 12-core CPU 18GB CPU | 17.9 tok/s |
| M3 Pro 12-core CPU 18GB GPU | 21.1 tok/s |
| iPad Pro M1 256GB, using LLM Farm | 12.1 tok/s |
| AMD Ryzen 7 7800x3d CPU | 9.7 tok/s |
| Intel i7 14700k CPU | 9.8 tok/s |
| ROG Ally Ryzen Z1 Extreme, 25W, CPU | 5.3 tok/s |
| ROG Ally Ryzen Z1 Extreme, 15W, CPU | 5.05 tok/s |
| GeForce RTX 4080 OC GPU | 78.1 tok/s |
| Zotac Trinity non-OC 4080 Super GPU | 71.6 tok/s |
| RTX 4070 TI Super GPU | 62 tok/s |
| RTX 4070 Super GPU | 58.2 tok/s |
| AMD 7900 XTX GPU | 70.1 tok/s |
| AMD RX 6800XT 16GB GPU | 52.9 tok/s |
| Razer Blade 2021, RTX 3070 TI GPU | 41.8 tok/s |
| Razer Blade 2021, Ryzen 5900HX CPU | 7.0 tok/s |
A small observation, overclocking RTX 4060 and 4090 I noticed that LM Studio/llama.cpp doesn't benefit from core speeds yet gains from memory frequency.
Updated on March 14, more configs tested
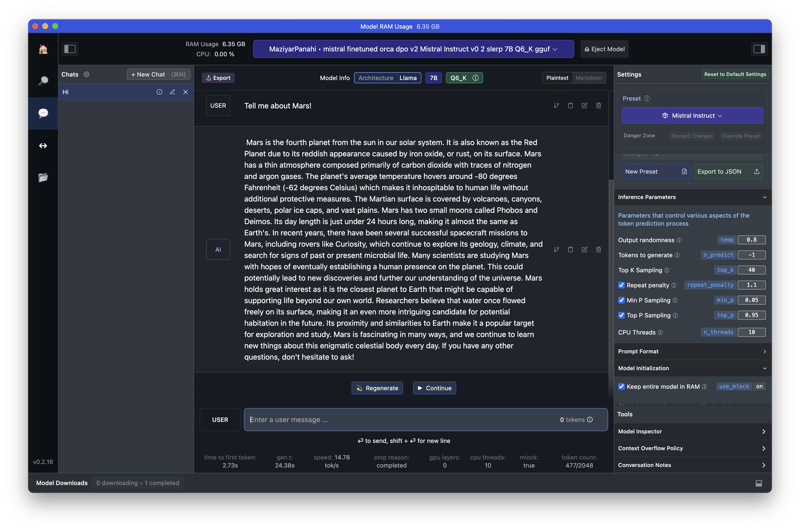
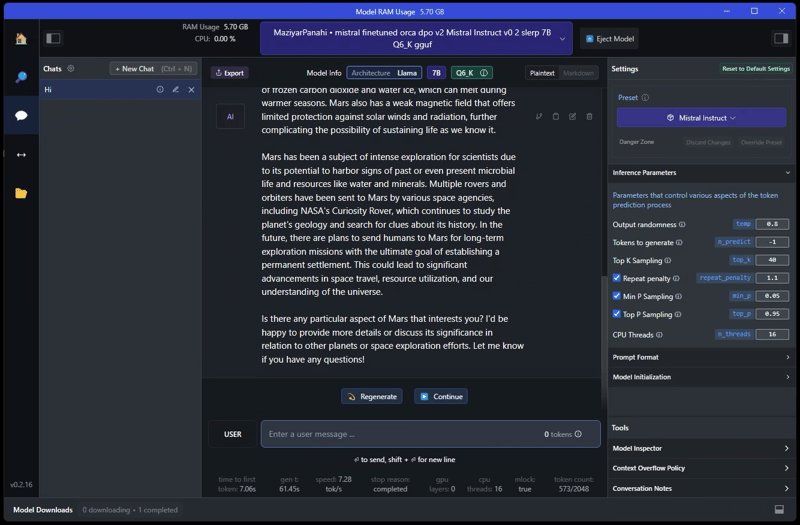
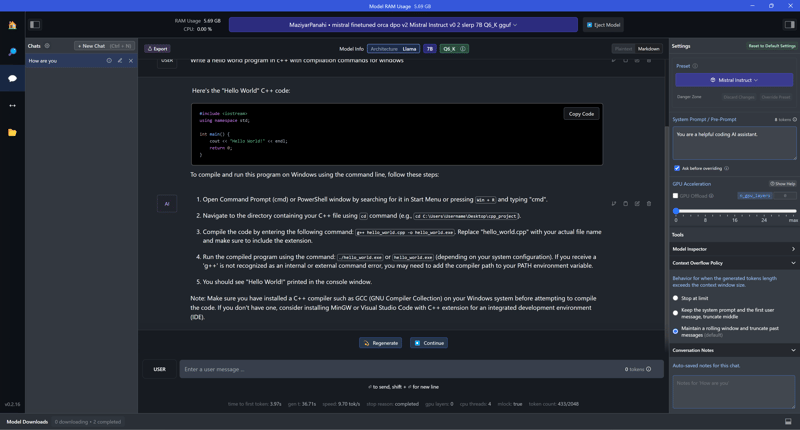
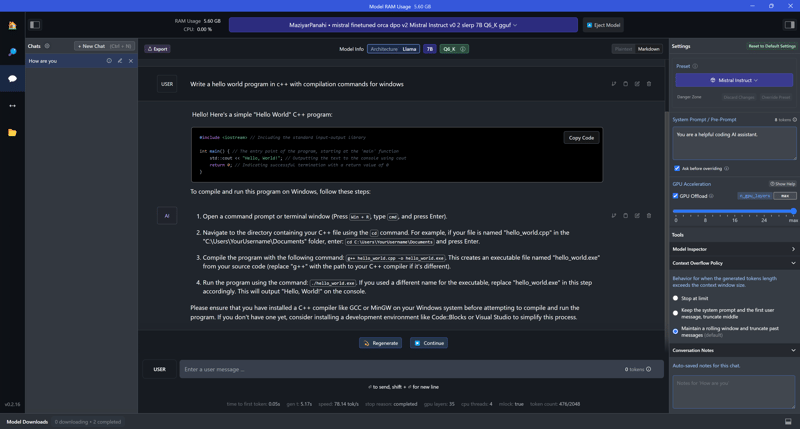
Today, tools like LM Studio make it easy to find, download, and run large language models on consumer-grade hardware. A typical quantized 7B model (a model with 7 billion parameters which are squeezed into 8 bits each or even smaller) would require 4-7GB of RAM/VRAM which is something an average laptop has.
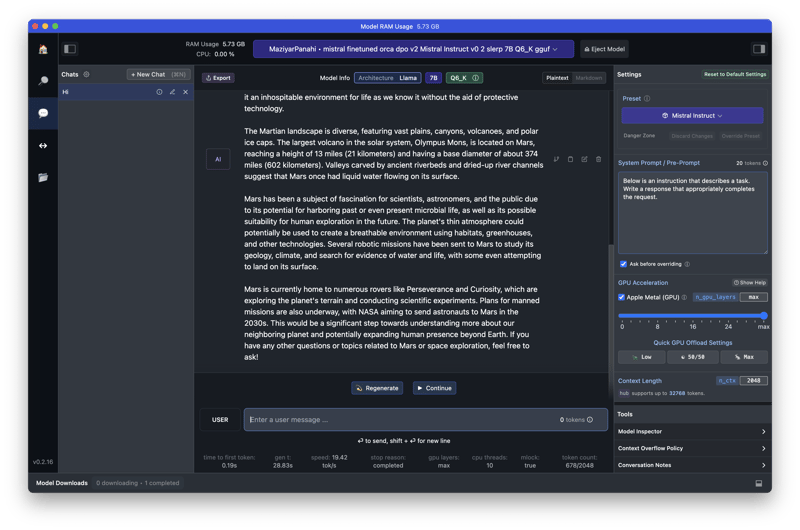
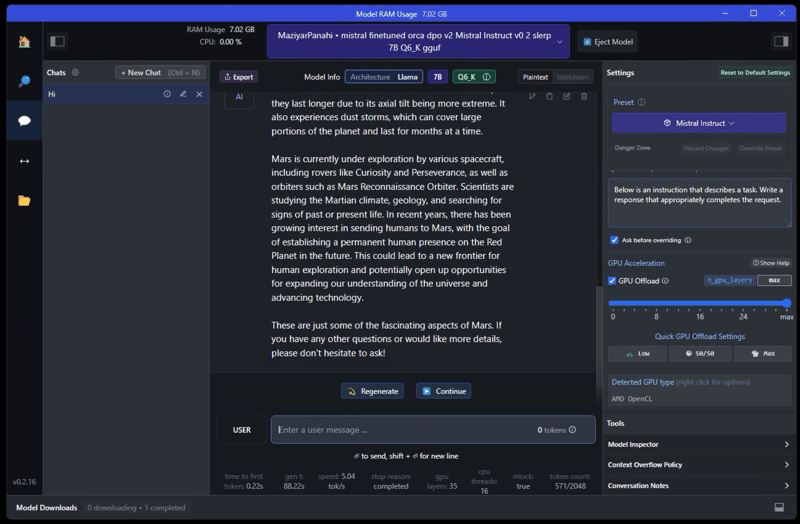
LM Studio allows you to pick whether to run the model using CPU and RAM or using GPU and VRAM. It also shows the tok/s metric at the bottom of the chat dialog
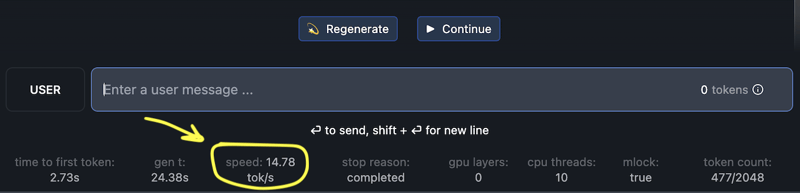
I have used this 5.94GB version of fine-tuned Mistral 7B and did a quick test of both options (CPU vs GPU) and here're the results. I have also added a few cases with Flash Attention (FA) enabled (added in recent versions of LM Studio under "Model initialisation" category).
Tokens/second
| Spec | Result |
|---|---|
| Apple M1 Pro CPU | 14.8 tok/s |
| Apple M1 Pro GPU | 19.4 tok/s |
| AMD Ryzen 7 7840U CPU | 7.3 tok/s |
| AMD Radeon 780M iGPU | 5.0 tok/s |
| AMD Ryzen 5 7535HS CPU | 7.4 tok/s |
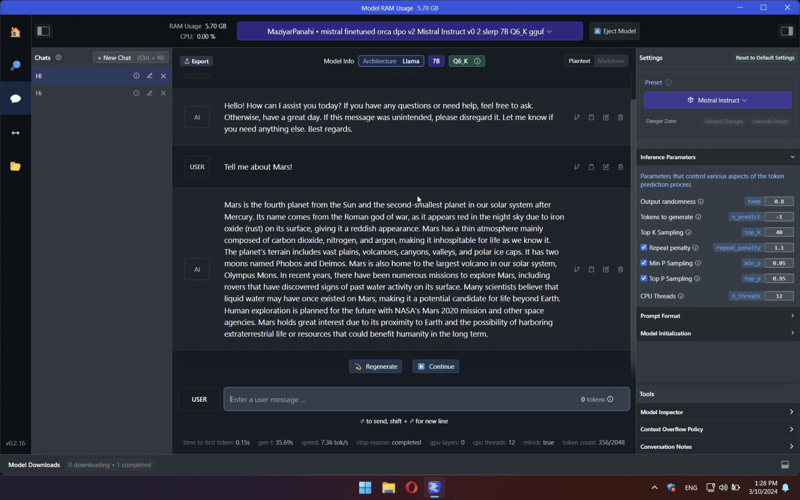
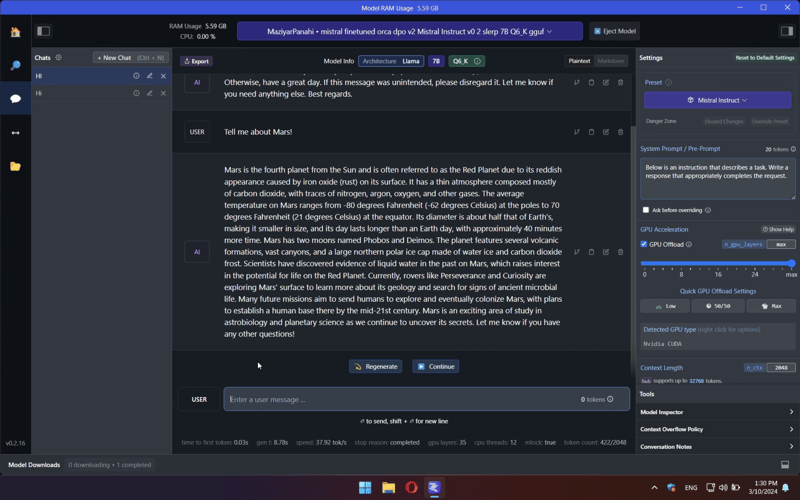
| GeForce RTX 4060 Mobile OC GPU | 37.9 tok/s |
| AMD Ryzen 7 7800x3d CPU | 9.7 tok/s |
| GeForce RTX 4080 OC GPU | 78.1 tok/s |
Hardware Specs
2021 M1 Mac Book Pro, 10-core CPU(8 performance and 2 efficiency), 16-core iGPU, 16GB of RAM
-
2023 AOKZEO A1 Pro gaming handheld, AMD Ryzen 7 7840U CPU (8 cores, 16 threads), 32 GB LPDDR5X RAM, Radeon 780M iGPU (using system RAM as VRAM), TDP at 30W
- 3D Mark TimeSpy GPU Score 3000
- 3D Mark TimeSpy CPU Score 7300
-
2023 MSI Bravo C7VF-039XRU laptop, AMD Ryzen 5 7535HS CPU (6 cores, 12 threads, 54W), 16GB DDR RAM, GeForce RTX 4060 (8GB VRAM, 105W)
- GPU was slightly undervalued/overlocked, 3D Mark TimeSpy GPU Score 11300
- 3D Mark TimeSpy CPU Score 7600
Desktop PC, AMD Ryzen 7 7800x3d (8 cores 16 threads, 78w during test), 6200 DDR5, GeForce RTX 4080 16GB VRAM (slightly overclocked, 228w during test)
Screenshots
Mac
AOKZOE
MSI
Desktop PC
P.S>
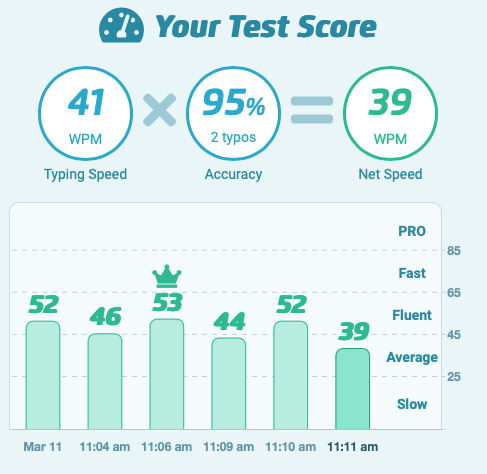
It just hit me that while an average persons types 30~40 words per minute, RTX 4060 at 38 tokens/second (roughly 30 words per second) achieves 1800 WPM.
P.P.S>
Thanks to Sergey Zinchenko added the 4th config (
7800x3d + GeForce RTX 4080)


