Diving into the world of regression and forecasting metrics can be a real head-scratcher, especially if you're a newcomer. Trust me, I've been there—haphazardly applying every popular metric scholars swear by, only to be left puzzled by the results.
Ever wondered why your MAE, MSE, and RMSE values look stellar, but your MAPE is through the roof? Yep, me too.
That's why I set out on this journey to create an experimental notebook, aiming to demystify how different metrics actually behave.
The Objective 🎯
The goal of this notebook isn't to find the "one metric to rule them all" for a specific dataset. Instead, I want to understand how various metrics respond to controlled conditions in both dataset and model. Think of this as a comparative study, a sort of "Metrics 101" through the lens of someone who's still got that new-car smell in the field. This way, when I'm plunged into real-world scenarios, I'll have a better grip on interpreting my metrics.
Metrics Investigated 🔍
To get a comprehensive view, I've opted to explore a selection of metrics that are commonly leveraged in regression and forecasting problems. Here's the lineup:
Mean Absolute Error (MAE):
Definition: It measures the average magnitude of the errors between predicted and observed values.
Formula:
MAE=n1i=1∑n∣yi−y^i∣
where
(yi)
is the actual value,
(y^i)
is the predicted value, and
(n)
is the number of observations.
Mean Squared Error (MSE):
Definition: It measures the average of the squares of the errors between predicted and observed values. It gives more weight to large errors.
Formula:
MSE=n1i=1∑n(yi−y^i)2
Root Mean Squared Error (RMSE):
Definition: It represents the sample standard deviation of the differences between predicted and observed values. It's the square root of MSE.
Formula:
RMSE=MSE
Mean Absolute Percentage Error (MAPE):
Definition: It measures the average of the absolute percentage errors between predicted and observed values.
Formula:
MAPE=n100i=1∑n∣∣yiyi−y^i∣∣
Note: MAPE can be problematic if the actual value
(yi)
is zero for some observations.
Mean Absolute Scaled Error (MASE):
Definition: It measures the accuracy of forecasts relative to a naive baseline method. If MASE is lower than 1, the forecast is better than the naive forecast.
Formula:
MASE=∑i=2n∣yi−yi−1∣∑i=1n∣yi−y^i∣
R-squared (Coefficient of Determination):
Definition: It indicates the proportion of the variance in the dependent variable that is predictable from the independent variable(s).
Formula:
R2=1−∑i=1n(yi−yˉ)2∑i=1n(yi−y^i)2
where
(yˉ)
is the mean of the observed data.
Symmetric Mean Absolute Percentage Error (sMAPE):
Definition: It's a variation of MAPE that addresses some of its issues, especially when the actual value is zero.
Formula:
sMAPE=n100i=1∑n(∣yi∣+∣y^i∣)/2∣yi−y^i∣
Mean Bias Deviation (MBD):
Definition: It calculates the average percentage bias in the predicted values.
Formula:
MBD=n100i=1∑nyiyi−y^i
Severity and Directional Emojis 🔥👉
Let's face it, numbers alone can be dry, and if you're like me, you might crave a more visceral sense of how well your model is doing. Enter severity and directional emojis. These little symbols provide a quick visual cue for interpreting metric results, ranging from "you're nailing it" to "back to the drawing board."
Disclaimer: Keep in mind that these categorizations are user-defined and could vary depending on the context in which you're working.
Standard Error Metrics (MAE, MSE, RMSE) Categorization 📊
To clarify, the concept of Normalized Error Range stems from dividing the error by the range (max - min) of the training data.
For this experiment, I've synthesized datasets using mathematical functions like sine and cosine, which offer a controlled level of predictability. On the modeling end, I've used statsmodels.tsa.ar_model.AutoReg and OffsetModel. I chose AutoReg for its foundational role in time series forecasting, while OffsetModel serves to mimic good performance by shifting test data. This entire endeavor is laser-focused on forecasting problems, underscoring the fact that all forecasting issues are essentially regression problems, just not the other way around as far as I understand.
Highlights of Findings ✨
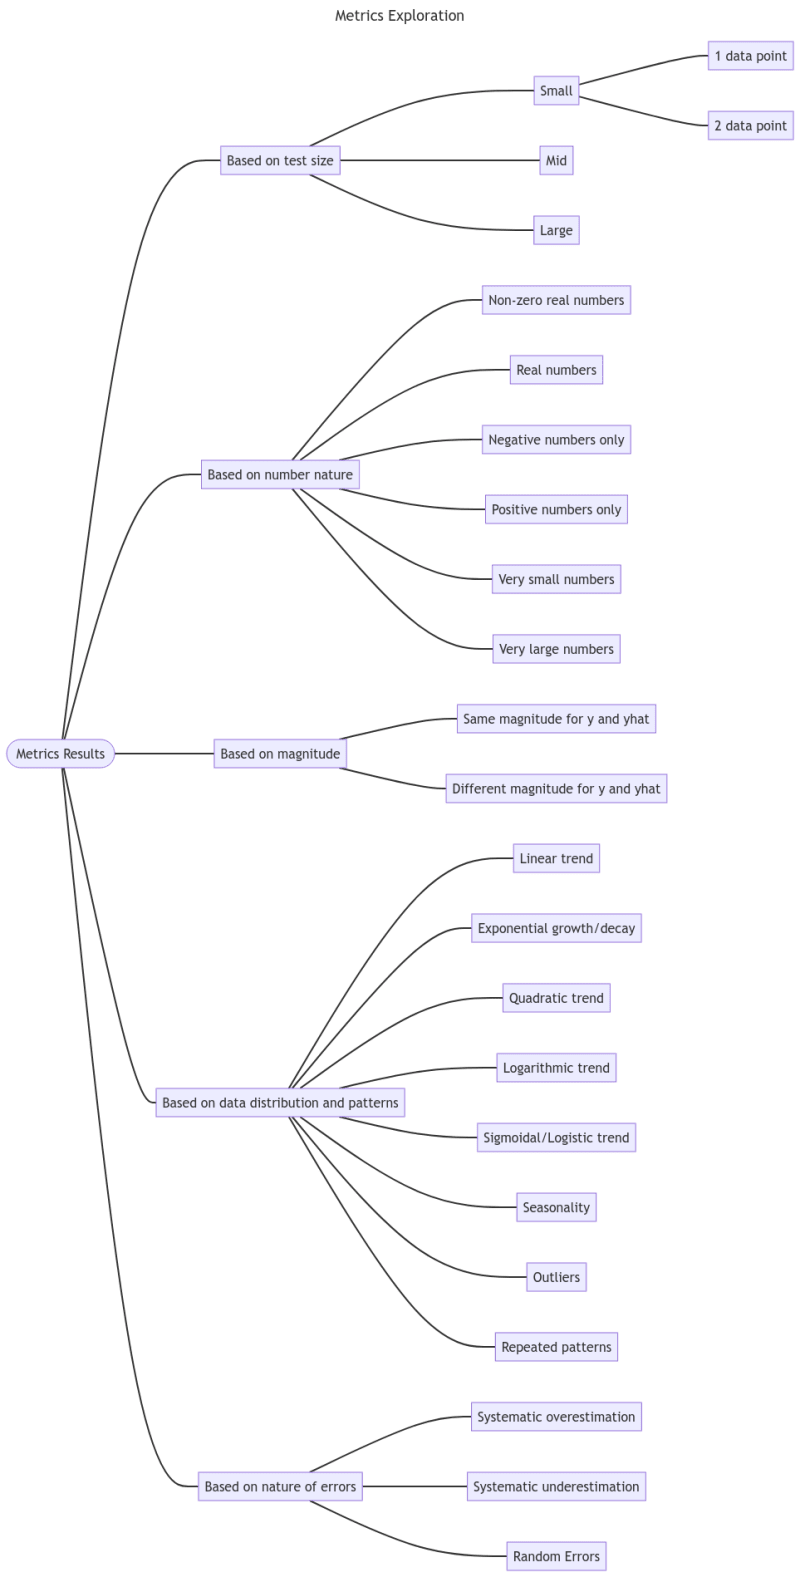
To navigate the labyrinth of metrics, I've laid out my explorations in a tree graph, which you can check out below:
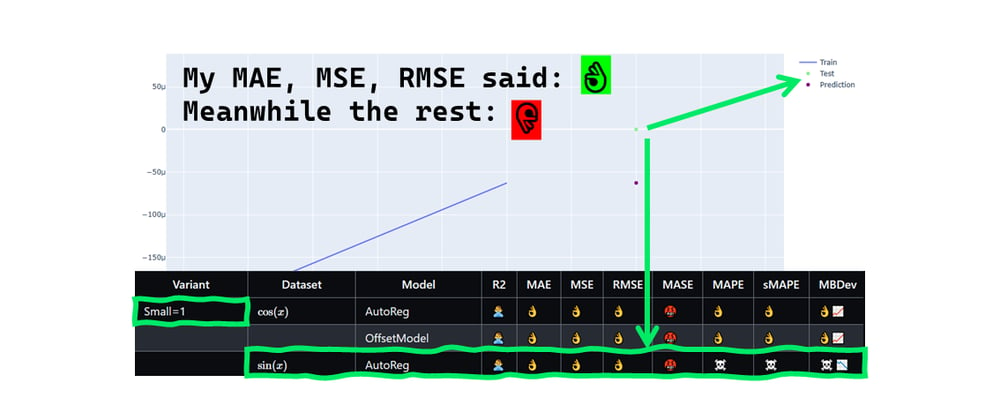
The table here provides just a glimpse into the first phase of my deep dive into metrics. For those hungry for the full rundown, it's available right here. Click 📊 for the plot.
Inconsistent R2 Scores: Almost all of the AutoReg and OffsetModel experiments yielded R2 scores that were either nonexistent (🙅♂️) or poor (🛑). Only one OffsetModel experiment on a large dataset achieved an "Acceptable" R2 score (👌).
Good Performance on Standard Errors: Across various test sizes and datasets, both AutoReg and OffsetModel generally performed "Very Acceptable" (👌) in terms of MAE, MSE, and RMSE metrics.
Problematic MASE Scores: Every model configuration led to "Worse Than Naive Forecast Model" (🤬) MASE scores. This suggests that these models might not be better than a simple naive forecast in certain aspects.
Diverse MAPE and sMAPE Responses: The models varied significantly in their MAPE and sMAPE scores, ranging from "Very Acceptable" (👌) to "Exceedingly High" (☠ and 💀), especially on sine (
sin(x)
) datasets.
Bias Direction: The Directional Emojis indicate a tendency for the models to either overestimate (📈) or underestimate (📉) the values. The direction of bias appears consistent within the same dataset but varies between datasets.
Complexity vs. Error: Larger test sizes didn't necessarily yield better error metrics. In fact, some larger test sizes led to "High" (❌) and even "Very High" (💀) errors, as seen in the last row of the table.
Dataset Sensitivity: The models' performance was noticeably different between the sine (
sin(x)
) and cosine (
cos(x)
) datasets, showing that dataset characteristics heavily influence metric values.
Best Scenario: If one had to pick, OffsetModel with a large dataset and the sine function (
sin(x)
) yielded a balanced outcome, achieving "Acceptable" (👌) ratings in almost all metrics, barring MASE (🤬).
Limitations & Risks: It's important to remember that these experiments used synthetic data and specific models; thus, the results may not be universally applicable. Caution should be exercised when generalizing these insights.
Please note that these insights are derived from synthetic data and controlled experiments. They are intended to offer a glimpse into the behavior of different metrics and should be used with caution in practical applications.
Points for Critique 🤔
I'm all ears for any constructive feedback on various fronts:
Did I get the interpretation of these metrics right?
Are there any hidden biases that I might have missed?
Is there a more suitable metric that should be on my radar?
Did you spot a typo? Yes, those bother me too.
Digging into metrics is a lot like treasure hunting; you don't really know what you've got until you put it under the microscope. That's why I'm so eager to get your feedback. I've listed a few questions above, but let's delve a bit deeper.
Interpretation of Metrics: I've given my best shot at understanding these metrics, but it's entirely possible that I've overlooked some nuances. If you think I've missed the mark or if you have a different angle, I'm keen to hear it.
Potential Biases: When you're neck-deep in numbers, it's easy to develop tunnel vision and miss out on the bigger picture. Have I fallen into this trap? Your external perspective could provide invaluable insights.
Alternative Metrics: While I've focused on some of the most commonly used metrics, the field is vast. If there's a gem I've missed, do let me know. I'm always up for adding another tool to my analytical toolbox.
Typos and Errors: Mistakes are the bane of any data scientist's existence, and not just in code. If you've spotted a typo, I'd appreciate the heads up. After all, clarity is key when it comes to complex topics like this.
So, am I on the right track, or is there room for improvement?
Your input could be the missing puzzle piece in my metrics exploration journey.
Conclusion 🤝✅
So there it is—my metric safari in a nutshell. It's been an enlightening experience for me, and I hope it shines some light for you too. I'm still on the learning curve, and I'd love to hear your thoughts. Whether it's a critique or a thumbs-up, all feedback is golden.
If this sparked your curiosity, let's keep the conversation going. Feel free to drop a comment below, write your own post in response, or reach out to me directly at my link. If you'd like to delve deeper, the full summary of my findings is available here. Better yet, why not conduct your own investigations? I'd be thrilled to see where you take it. You can follow my progress and check out my portfolio repository here
A bunch of Data analysis +AI notebooks I'd worked on almost a daiLY basis
DAIly
A bunch of Data Analysis and Artificial Intelligence notebooks 🤖 I'd worked on almost a daiLY basis 👨💻
Ideas
This directory might contain notes or outlines of potential data analysis or AI projects that I'm considering working on in the future. These might be in the form of brainstorming notebooks, rough outlines powerpoint of project ideas, or notes on interesting data sources or tools that I want to explore further
This directory might contain more practical information, such as code snippets or tutorials that I've found helpful in my data analysis and AI work. These could be tips on how to use specific libraries…