Hello Coders,
This article presents a curated list with open-source Javascript Chart Libraries we can use without much effort to showcase relevant information in our projects. Initially, the list was bigger (10+ items) but I decided to remove all projects without a release or even a commit in the last 12mo despite the notoriety. Using a Chart Library that consolidates and presents data visually might help people to understand a large amount of information and make better business decisions.
Thanks for reading! - Content provided by App Generator.
- Chartjs - Simple JavaScript charting for designers & devs
- Google Charts - based on pure HTML5/SVG technology
- Apache eCharts - provides more than 20 chart types
- D3 - JavaScript library for manipulating docs based on data
- Toast Charts - easy to use Charts.
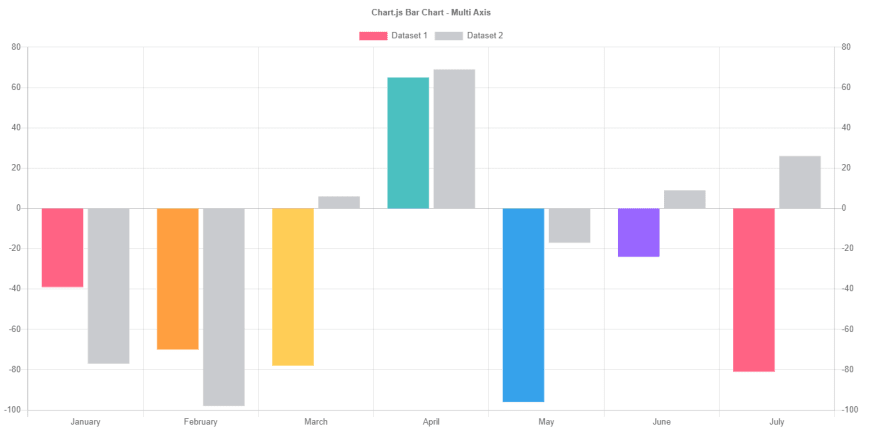
ChartJS Library
Chart.js is a community-maintained project, with 52k+ Github stars and 350+ contributors. Using this chart library we can visualize your data in 8 different ways, each one with specific options regarding customization. Chart.js can be integrated with plain JavaScript or with different module loaders: CDN usage, local (via download), or using bundlers (Webpack, Rollup).
- ChartJS - the official website
- ChartJS Samples: Radar, Polar Area, Simple Bar Charts
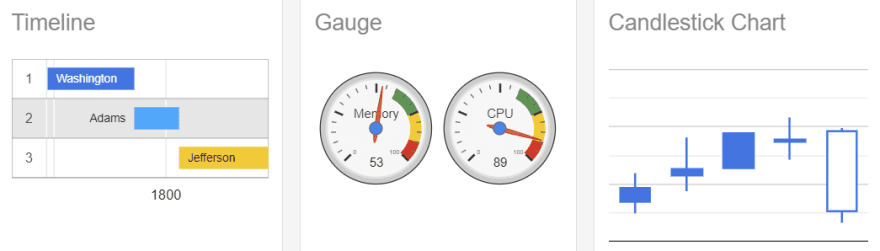
Google Charts
Google Charts provides a simple way to visualize data on different patterns starting from bar and area charts to complex ones like GeoChart and Gauge (speedometer) - full list here. Charts are based on pure HTML5/SVG technology (adopting VML for old IE versions), so no plugins are required. All of them are interactive and zoomable.
- Google Charts - homepage
- Getting Starting Guide - docs entry point
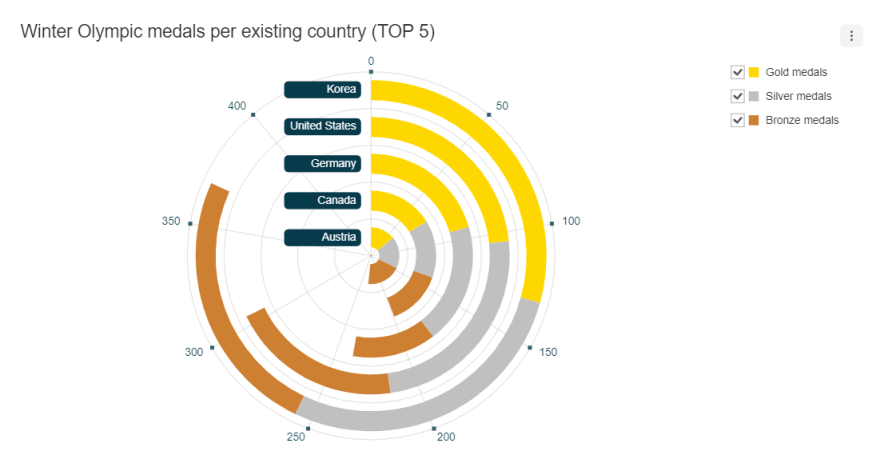
Apache ECharts
Apache ECharts provides more than 20 chart types available out of the box, along with a dozen components, and each of them can be arbitrarily combined to use. The default design follows visualization principles, supports responsive design. Flexible configurations make it easy to customize.
- Apache ECharts - project homepage
- ECharts Samples - interactive index
ToastUI Charts
TOAST UI Chart is a Beautiful Statistical Data Visualization library with versions for React and Vue. TOAST UI Chart makes your data pop and presents it in a manner that is easy to understand. Furthermore, it provides a wide range of theme options for customizing the charts to be suitable for all of your services. Chart components like the title, axes, legends, tooltips, plots, series, and more can be customized through the options.
- ToastUI Charts - official repository
- ToastUI Charts - official website
D3 Charts
D3.js is a JavaScript library for manipulating documents based on data. D3 helps you bring data to life using HTML, SVG, and CSS. D3 allows you to bind arbitrary data to a Document Object Model (DOM), and then apply data-driven transformations to the document. For example, you can use D3 to generate an HTML table from an array of numbers. Or, use the same data to create an interactive SVG bar chart with smooth transitions and interaction.
- D3 Charts - official HOMEpage
- D3 Samples - many interactive samples
Thanks for reading! For more resources please access:
- JavaScript chart libraries for 2019 - related content with more libraries
- AppSeed - for production-ready starters and support